Women Stepping to the Forefront in the Workplace
How many women work in your company?
With the recent focus on equality and diversity chances are it has been a frequent topic of discussion, especially during the month of March, which is Women’s History Month.
Women are an invaluable part of today’s workforce bringing unique experiences and talents to the table that can make a company well rounded.
You might have seen the numerous Women’s Marches that happened earlier this year across the U.S. and the World. Estimates say that about 5 million people participated, that showed me that there are A LOT of people in the world who care about women’s rights including those from different genders, backgrounds, countries, religious, and political beliefs.
Since there were a lot of underlying motivators in the marches, many of them political which I don’t want to get into, let’s focus on women in the workplace.

Women are valuable, knowledgeable, and powerful. Historically that opinion hasn’t always been prevalent or considered valid, so the fact that women’s worth is brought up more and more in today’s culture is a great thing.
A variety of people, men and women, are contributing to the dialogue of what a woman’s place is in business and the world in general. It is only by having everyone join the discussion and treating all participants with respect that we can make progress.
The U.S. Department of Labor’s website has a vast amount of data regarding Women in the workforce, you can see some of the charts below. They were created using Tableau which is one of my favorite Business Intelligence software packages because of its ability to turn raw data into stunning charts and graphs that anyone can understand, and allows the user to manipulate the data they want to see! How cool is that!? Sorry had to geek out for a moment!
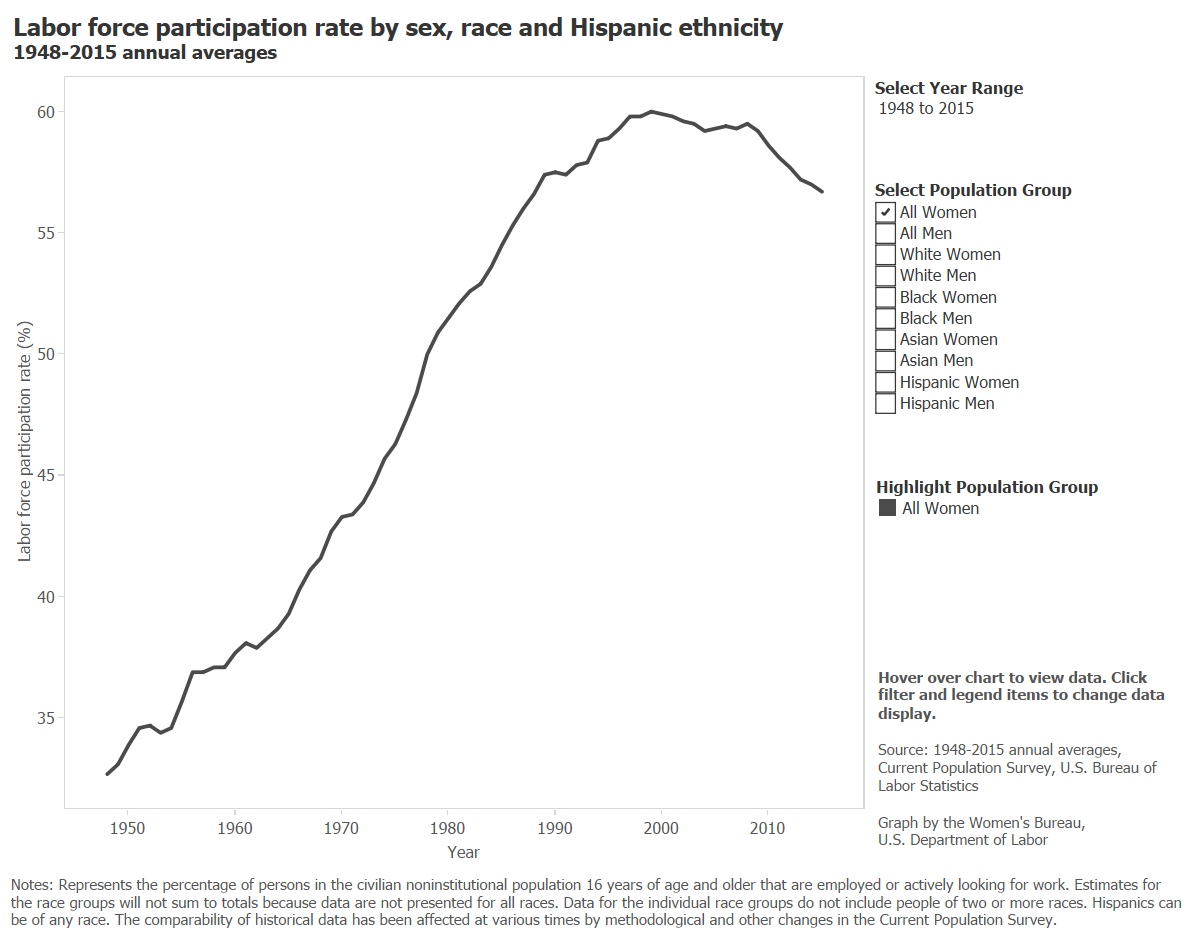
These first graph shows the percentage of women in the Labor Force and how it has risen from 30% to 57% since 1950.
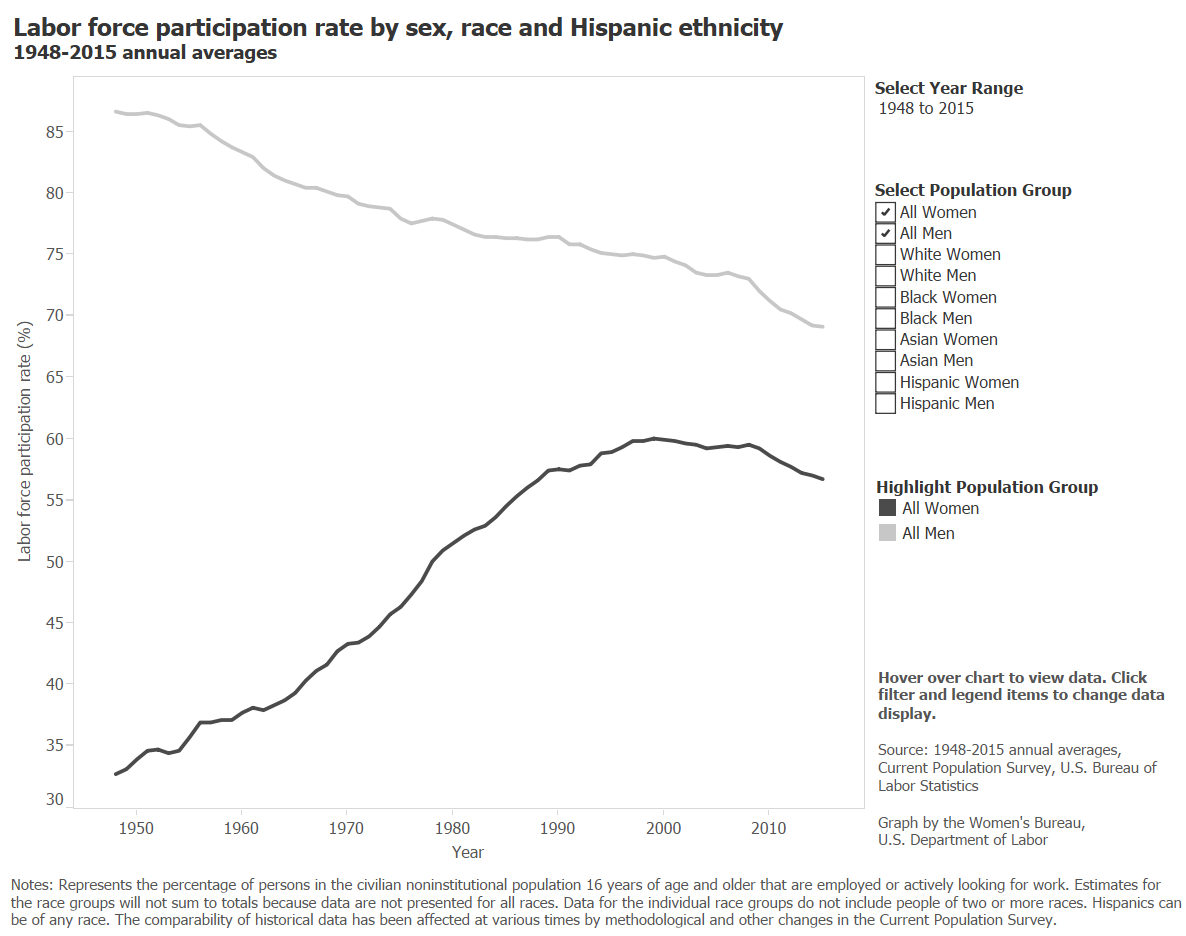
The second graph shows the comparison of the number of men in the workforce (the top faded line) to the number of women (the lower bolded line).
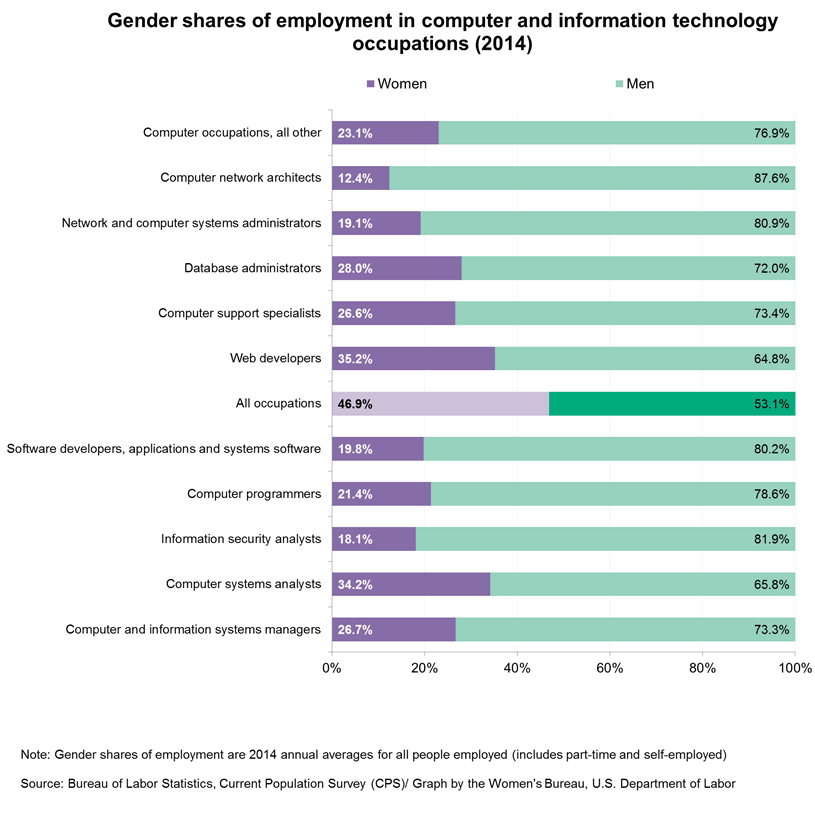
Another graph shows a comparison of the number of women and men in various IT roles as of 2014.
Visit https://www.dol.gov/wb/ for the Department of Labor’s Women’s Bureau and more interesting graphs.
I don’t know about you but these statistics are rather startling to me. Granted there are a lot of reasons why less women are in the labor force then men, and there has been a significant rise of women in the workplace over the years, but more needs to be done.
Kane Partners has focused a number of blogs over the last couple of months on women and Women’s History to contribute our voice to the conversation.
How can you join the conversation and support women in the workplace and women in STEM?
Talk about it, be respectful, be honest.
Pretty simple, right?